Validation of ice thickness - Full domain
Bulletin date: 2019-05-16
Model: ARC MFC - TOPAZ
Data source: UCL CryoSAT-2 sea ice thickness
Validation statistics summary
| Bias (m) | RMS (m) | total grids | low SIT | OK SIT | high SIT | |
|---|---|---|---|---|---|---|
| Best estimate | -1.15 | 1.28 | 43440 | 21738 | 21656 | 46 |
| Day 1 forecast | -1.15 | 1.28 | 43440 | 21742 | 21650 | 48 |
| Day 4 forecast | -1.15 | 1.28 | 43440 | 21719 | 21675 | 46 |
| Day 7 forecast | -1.15 | 1.28 | 43440 | 21714 | 21678 | 48 |
| Day 10 forecast | -1.16 | 1.29 | 43440 | 22091 | 21306 | 43 |
Numbers in the three rightmost columns are grid counts. Regions with high/low sea ice thickness correspond to areas with model offsets from the gridded observations outside of one standard deviation. (Standard deviations are provided in the observational product.)
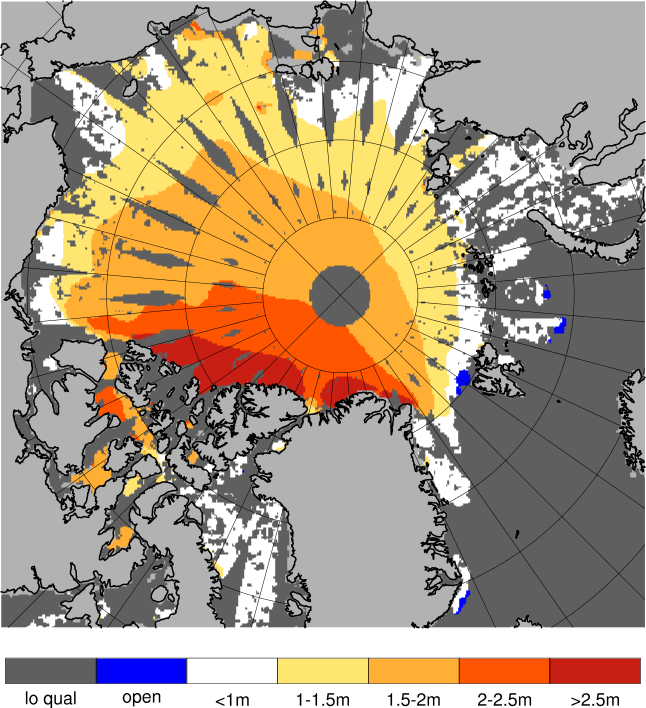
Definition of categories:
| Category | Sea ice thickness |
|---|---|
| c1 | <1m |
| c2 | 1 - 1.5m |
| c3 | 1.5 - 2m |
| c4 | 2 - 2.5m |
| c5 | 2.5 - 3m |
| c6 | >3m |
Best estimate vs. observations
Contingency table
| observations | |||||||||
|---|---|---|---|---|---|---|---|---|---|
| open | c1 | c2 | c3 | c4 | c5 | c6 | |||
| m o d e l |
open | 0 | 0 | 0 | 0.001 | 0 | 0 | 0.001 | |
| c1 | 0 | 0.002 | 0.044 | 0.119 | 0.051 | 0.019 | 0.019 | ||
| c2 | 0 | 0 | 0.004 | 0.045 | 0.134 | 0.096 | 0.025 | ||
| c3 | 0 | 0 | 0.001 | 0.014 | 0.071 | 0.141 | 0.065 | ||
| c4 | 0 | 0 | 0 | 0 | 0.007 | 0.035 | 0.061 | ||
| c5 | 0 | 0 | 0 | 0 | 0 | 0.002 | 0.034 | ||
| c6 | 0 | 0 | 0 | 0 | 0 | 0 | 0.007 | ||
See category definitions for details.
Statistical distribution
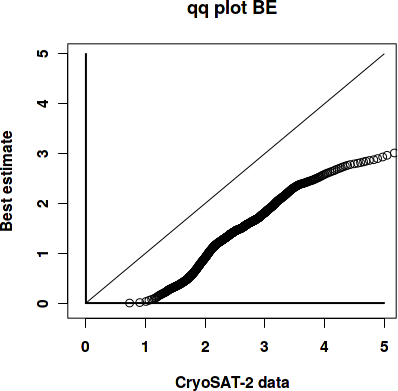
|
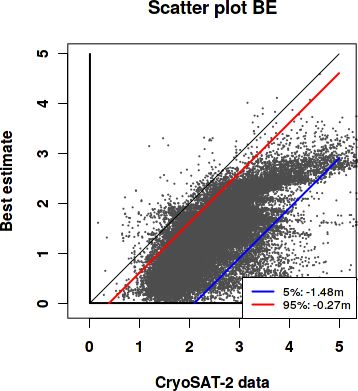
|
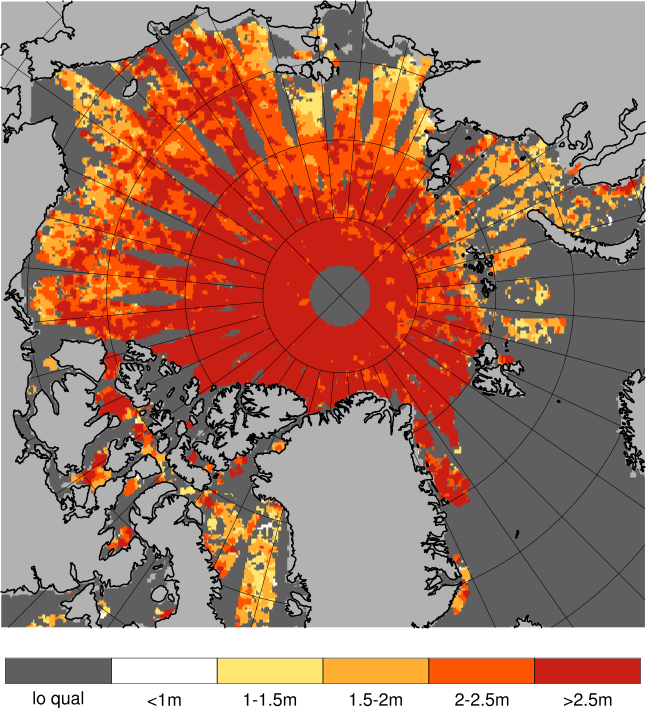
Observed sea ice thickness from CryoSAT
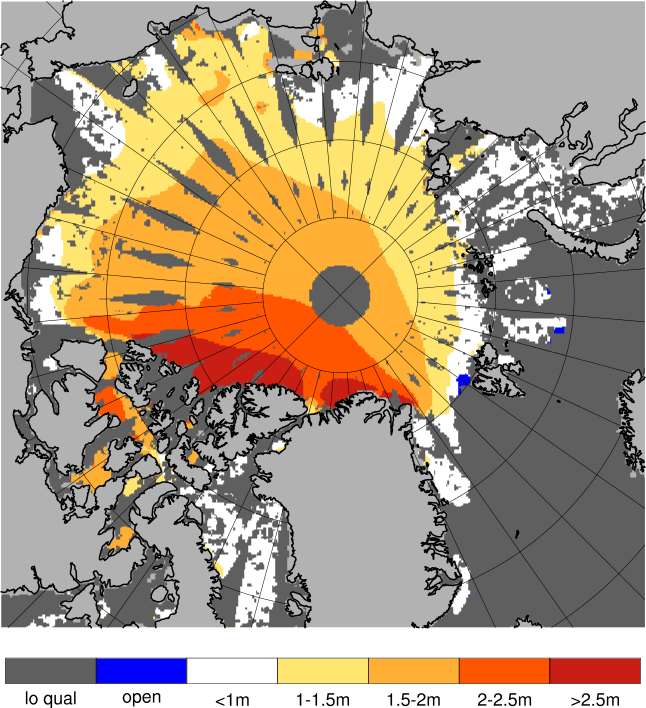
Sea ice thickness, best estimate product
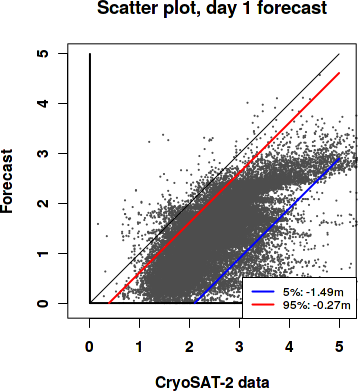
Day 1 forecast vs. observations
Contingency table
| observations | |||||||||
|---|---|---|---|---|---|---|---|---|---|
| open | c1 | c2 | c3 | c4 | c5 | c6 | |||
| m o d e l |
open | 0 | 0 | 0 | 0.001 | 0 | 0 | 0.001 | |
| c1 | 0 | 0.002 | 0.044 | 0.118 | 0.05 | 0.019 | 0.019 | ||
| c2 | 0 | 0.001 | 0.004 | 0.045 | 0.136 | 0.097 | 0.025 | ||
| c3 | 0 | 0 | 0.001 | 0.014 | 0.069 | 0.14 | 0.065 | ||
| c4 | 0 | 0 | 0 | 0.001 | 0.007 | 0.035 | 0.062 | ||
| c5 | 0 | 0 | 0 | 0 | 0 | 0.002 | 0.033 | ||
| c6 | 0 | 0 | 0 | 0 | 0 | 0 | 0.007 | ||
See category definitions for details.
Statistical distribution

|
|
Sea ice thickness, day 1 forecast

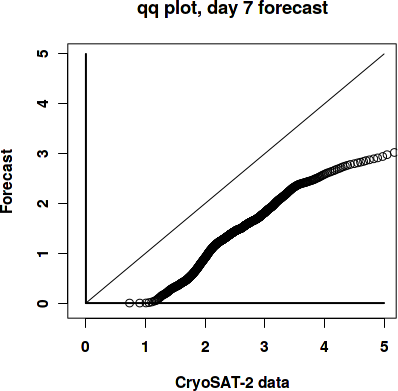
Day 7 forecast vs. observations
Contingency table
| observations | |||||||||
|---|---|---|---|---|---|---|---|---|---|
| open | c1 | c2 | c3 | c4 | c5 | c6 | |||
| m o d e l |
open | 0 | 0 | 0 | 0.001 | 0.001 | 0 | 0.002 | |
| c1 | 0 | 0.002 | 0.044 | 0.117 | 0.05 | 0.018 | 0.018 | ||
| c2 | 0 | 0 | 0.005 | 0.046 | 0.135 | 0.096 | 0.024 | ||
| c3 | 0 | 0 | 0.001 | 0.014 | 0.07 | 0.141 | 0.065 | ||
| c4 | 0 | 0 | 0 | 0.001 | 0.007 | 0.035 | 0.062 | ||
| c5 | 0 | 0 | 0 | 0 | 0 | 0.002 | 0.033 | ||
| c6 | 0 | 0 | 0 | 0 | 0 | 0 | 0.007 | ||
See category definitions for details.
Statistical distribution
|

|
Sea ice thickness, day 7 forecast
Generated by /metno/routine/sms/V2/SIthickness/c2iceWebPage.sh Fri May 31 01:04:02 UTC 2019 on arcmfcval