Validation of ice thickness - Full domain
Bulletin date: 2019-03-07
Model: ARC MFC - TOPAZ
Data source: UCL CryoSAT-2 sea ice thickness
Validation statistics summary
| Bias (m) | RMS (m) | total grids | low SIT | OK SIT | high SIT | |
|---|---|---|---|---|---|---|
| Best estimate | -0.9 | 1.05 | 47972 | 19322 | 28602 | 48 |
| Day 1 forecast | -0.89 | 1.04 | 47972 | 19011 | 28903 | 58 |
| Day 4 forecast | -0.9 | 1.04 | 47972 | 19118 | 28799 | 55 |
| Day 7 forecast | -0.88 | 1.03 | 47972 | 18529 | 29377 | 66 |
| Day 10 forecast | -0.89 | 1.04 | 47972 | 18891 | 29029 | 52 |
Numbers in the three rightmost columns are grid counts. Regions with high/low sea ice thickness correspond to areas with model offsets from the gridded observations outside of one standard deviation. (Standard deviations are provided in the observational product.)
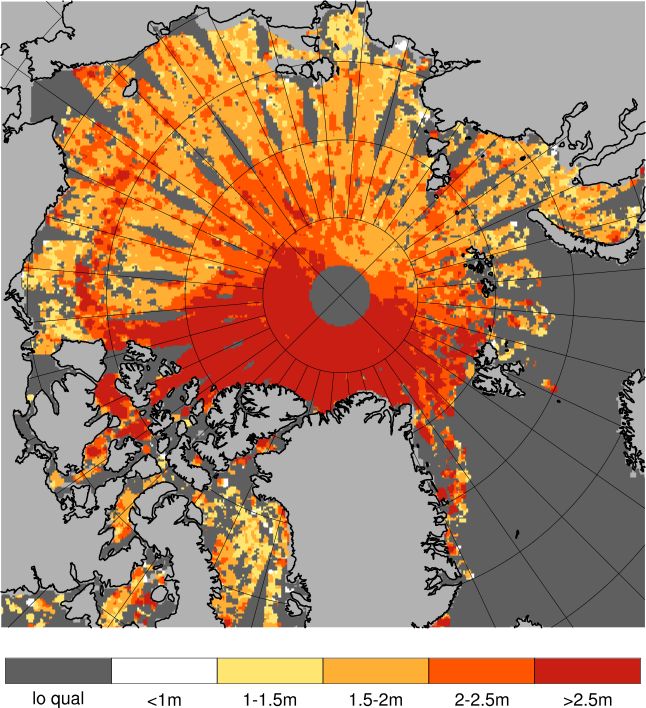
Definition of categories:
| Category | Sea ice thickness |
|---|---|
| c1 | <1m |
| c2 | 1 - 1.5m |
| c3 | 1.5 - 2m |
| c4 | 2 - 2.5m |
| c5 | 2.5 - 3m |
| c6 | >3m |
Best estimate vs. observations
Contingency table
| observations | |||||||||
|---|---|---|---|---|---|---|---|---|---|
| open | c1 | c2 | c3 | c4 | c5 | c6 | |||
| m o d e l |
open | 0 | 0 | 0 | 0 | 0 | 0.001 | 0 | |
| c1 | 0 | 0.006 | 0.065 | 0.143 | 0.049 | 0.014 | 0.009 | ||
| c2 | 0 | 0.001 | 0.029 | 0.239 | 0.163 | 0.035 | 0.004 | ||
| c3 | 0 | 0 | 0.006 | 0.031 | 0.028 | 0.066 | 0.024 | ||
| c4 | 0 | 0 | 0 | 0 | 0.002 | 0.015 | 0.052 | ||
| c5 | 0 | 0 | 0 | 0 | 0.001 | 0.002 | 0.016 | ||
| c6 | 0 | 0 | 0 | 0 | 0 | 0 | 0.001 | ||
See category definitions for details.
Statistical distribution
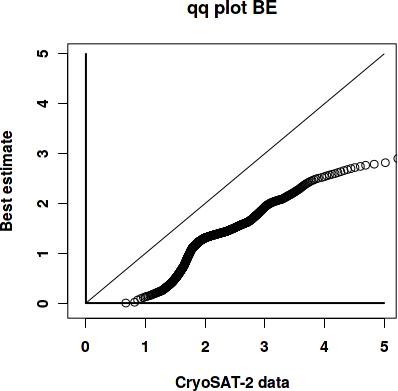
|
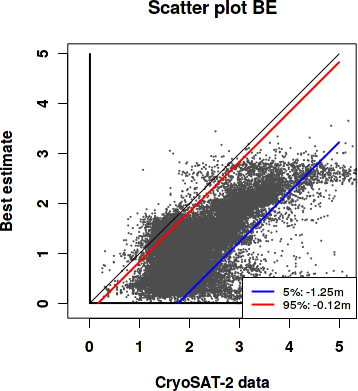
|
Observed sea ice thickness from CryoSAT
Sea ice thickness, best estimate product

Day 1 forecast vs. observations
Contingency table
| observations | |||||||||
|---|---|---|---|---|---|---|---|---|---|
| open | c1 | c2 | c3 | c4 | c5 | c6 | |||
| m o d e l |
open | 0 | 0 | 0 | 0 | 0 | 0.001 | 0.001 | |
| c1 | 0 | 0.006 | 0.065 | 0.142 | 0.047 | 0.014 | 0.009 | ||
| c2 | 0 | 0.001 | 0.029 | 0.239 | 0.163 | 0.035 | 0.004 | ||
| c3 | 0 | 0 | 0.006 | 0.032 | 0.029 | 0.066 | 0.022 | ||
| c4 | 0 | 0 | 0 | 0 | 0.002 | 0.016 | 0.054 | ||
| c5 | 0 | 0 | 0 | 0 | 0.001 | 0.002 | 0.016 | ||
| c6 | 0 | 0 | 0 | 0 | 0 | 0 | 0.001 | ||
See category definitions for details.
Statistical distribution

|

|
Sea ice thickness, day 1 forecast

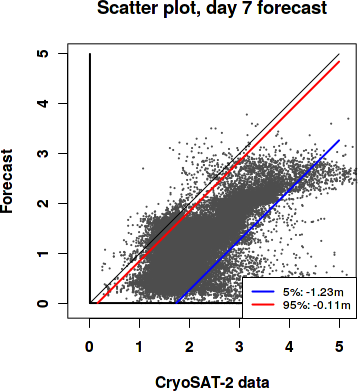
Day 7 forecast vs. observations
Contingency table
| observations | |||||||||
|---|---|---|---|---|---|---|---|---|---|
| open | c1 | c2 | c3 | c4 | c5 | c6 | |||
| m o d e l |
open | 0 | 0 | 0 | 0 | 0.001 | 0.001 | 0.001 | |
| c1 | 0 | 0.006 | 0.064 | 0.141 | 0.046 | 0.013 | 0.009 | ||
| c2 | 0 | 0.001 | 0.028 | 0.239 | 0.163 | 0.033 | 0.004 | ||
| c3 | 0 | 0 | 0.007 | 0.032 | 0.029 | 0.066 | 0.019 | ||
| c4 | 0 | 0 | 0 | 0.001 | 0.002 | 0.017 | 0.056 | ||
| c5 | 0 | 0 | 0 | 0 | 0.001 | 0.002 | 0.017 | ||
| c6 | 0 | 0 | 0 | 0 | 0 | 0 | 0.001 | ||
See category definitions for details.
Statistical distribution
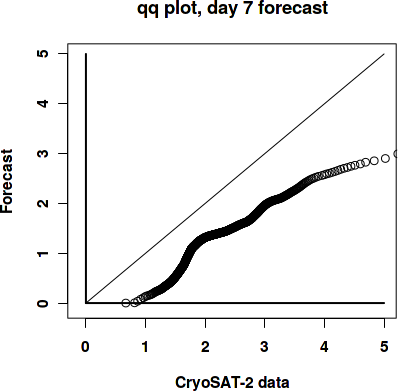
|
|
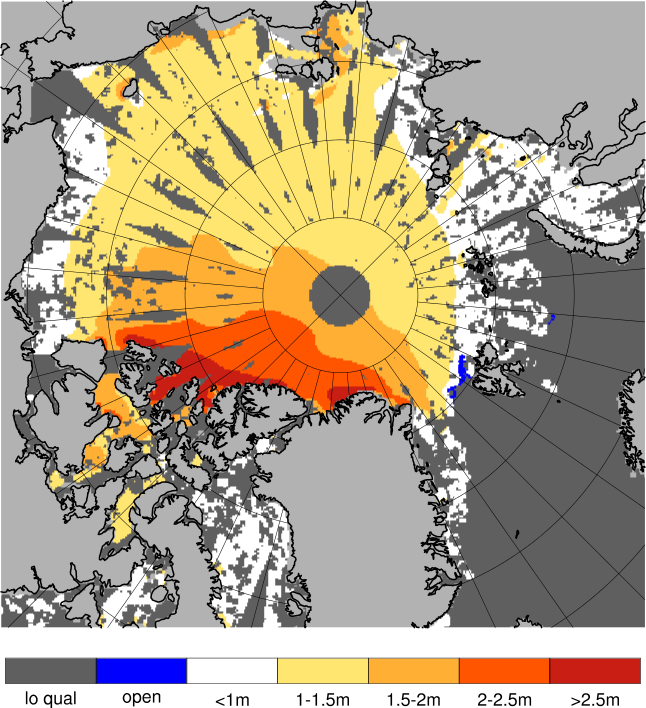
Sea ice thickness, day 7 forecast
Generated by /metno/routine/sms/V2/SIthickness/c2iceWebPage.sh Fri Mar 22 01:12:35 UTC 2019 on arcmfcval