Validation of ice thickness - Full domain
Bulletin date: 2019-01-24
Model: ARC MFC - TOPAZ
Data source: UCL CryoSAT-2 sea ice thickness
Validation statistics summary
| Bias (m) | RMS (m) | total grids | low SIT | OK SIT | high SIT | |
|---|---|---|---|---|---|---|
| Best estimate | -0.88 | 1.04 | 40571 | 18120 | 22391 | 60 |
| Day 1 forecast | -0.87 | 1.03 | 40571 | 18043 | 22468 | 60 |
| Day 4 forecast | -0.88 | 1.04 | 40571 | 18323 | 22191 | 57 |
| Day 7 forecast | -0.85 | 1.01 | 40571 | 17375 | 23129 | 67 |
| Day 10 forecast | -0.88 | 1.03 | 40571 | 18165 | 22343 | 63 |
Numbers in the three rightmost columns are grid counts. Regions with high/low sea ice thickness correspond to areas with model offsets from the gridded observations outside of one standard deviation. (Standard deviations are provided in the observational product.)
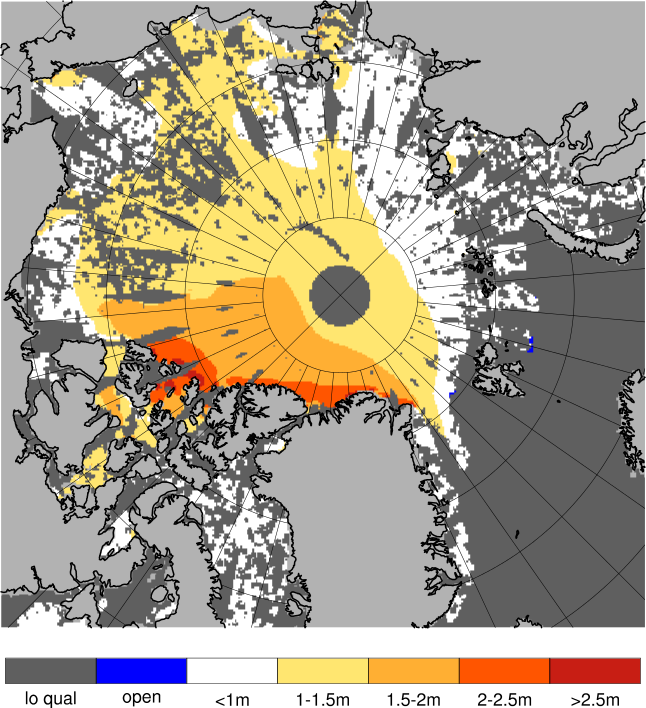
Definition of categories:
| Category | Sea ice thickness |
|---|---|
| c1 | <1m |
| c2 | 1 - 1.5m |
| c3 | 1.5 - 2m |
| c4 | 2 - 2.5m |
| c5 | 2.5 - 3m |
| c6 | >3m |
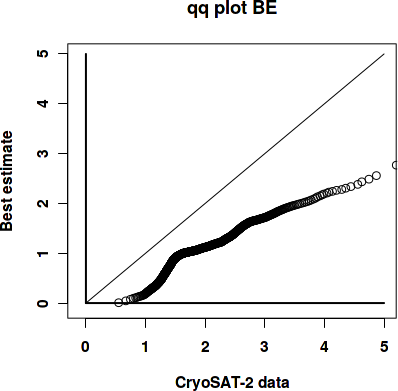
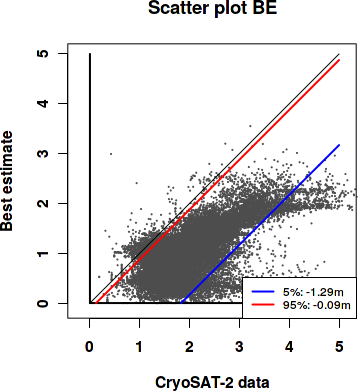
Best estimate vs. observations
Contingency table
| observations | |||||||||
|---|---|---|---|---|---|---|---|---|---|
| open | c1 | c2 | c3 | c4 | c5 | c6 | |||
| m o d e l |
open | 0 | 0 | 0 | 0.001 | 0 | 0 | 0 | |
| c1 | 0 | 0.012 | 0.21 | 0.164 | 0.046 | 0.017 | 0.007 | ||
| c2 | 0 | 0.005 | 0.122 | 0.121 | 0.087 | 0.041 | 0.003 | ||
| c3 | 0 | 0 | 0 | 0.004 | 0.034 | 0.047 | 0.048 | ||
| c4 | 0 | 0 | 0 | 0 | 0.001 | 0.003 | 0.022 | ||
| c5 | 0 | 0 | 0 | 0 | 0 | 0.001 | 0.002 | ||
| c6 | 0 | 0 | 0 | 0 | 0 | 0 | 0 | ||
See category definitions for details.
Statistical distribution
|
|
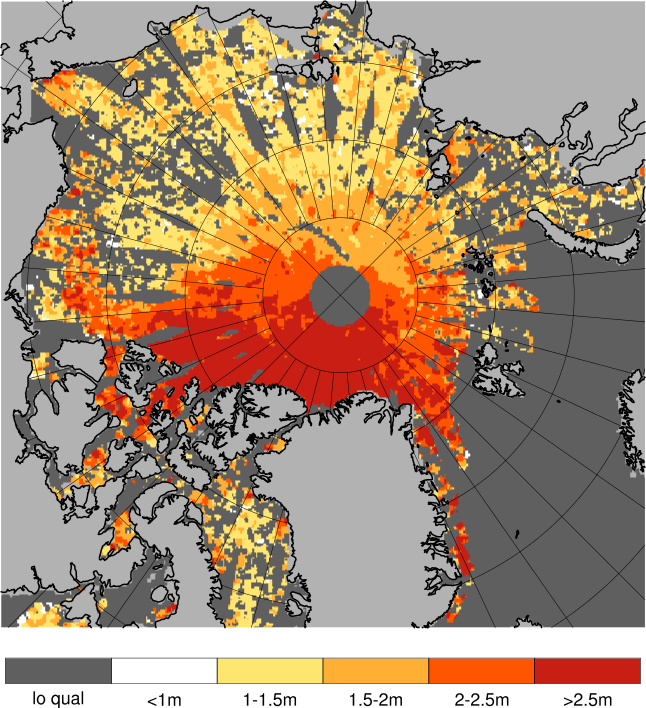
Observed sea ice thickness from CryoSAT
Sea ice thickness, best estimate product

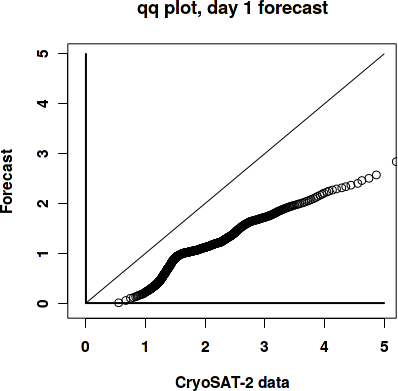
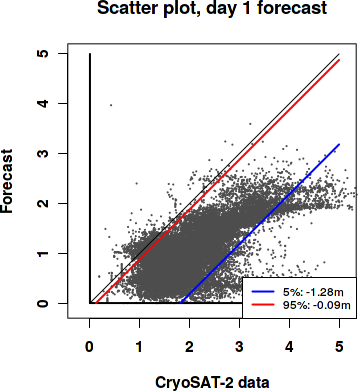
Day 1 forecast vs. observations
Contingency table
| observations | |||||||||
|---|---|---|---|---|---|---|---|---|---|
| open | c1 | c2 | c3 | c4 | c5 | c6 | |||
| m o d e l |
open | 0 | 0 | 0 | 0.001 | 0 | 0 | 0 | |
| c1 | 0 | 0.012 | 0.21 | 0.165 | 0.047 | 0.017 | 0.007 | ||
| c2 | 0 | 0.005 | 0.122 | 0.119 | 0.085 | 0.04 | 0.003 | ||
| c3 | 0 | 0 | 0 | 0.005 | 0.035 | 0.048 | 0.048 | ||
| c4 | 0 | 0 | 0 | 0 | 0.001 | 0.003 | 0.022 | ||
| c5 | 0 | 0 | 0 | 0 | 0 | 0.001 | 0.002 | ||
| c6 | 0 | 0 | 0 | 0 | 0 | 0 | 0 | ||
See category definitions for details.
Statistical distribution
|
|
Sea ice thickness, day 1 forecast

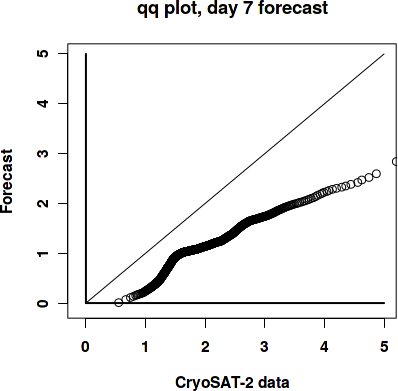
Day 7 forecast vs. observations
Contingency table
| observations | |||||||||
|---|---|---|---|---|---|---|---|---|---|
| open | c1 | c2 | c3 | c4 | c5 | c6 | |||
| m o d e l |
open | 0 | 0 | 0 | 0.001 | 0 | 0 | 0 | |
| c1 | 0 | 0.012 | 0.196 | 0.154 | 0.045 | 0.016 | 0.007 | ||
| c2 | 0 | 0.006 | 0.137 | 0.13 | 0.085 | 0.038 | 0.003 | ||
| c3 | 0 | 0 | 0 | 0.005 | 0.037 | 0.051 | 0.045 | ||
| c4 | 0 | 0 | 0 | 0 | 0.001 | 0.003 | 0.024 | ||
| c5 | 0 | 0 | 0 | 0 | 0 | 0.001 | 0.002 | ||
| c6 | 0 | 0 | 0 | 0 | 0 | 0 | 0 | ||
See category definitions for details.
Statistical distribution
|

|
Sea ice thickness, day 7 forecast
Generated by /metno/routine/sms/V2/SIthickness/c2iceWebPage.sh Fri Feb 8 01:10:06 UTC 2019 on arcmfcval