Validation of ice thickness - Full domain
Bulletin date: 2018-11-01
Model: ARC MFC - TOPAZ
Data source: UCL CryoSAT-2 sea ice thickness
Validation statistics summary
| Bias (m) | RMS (m) | total grids | low SIT | OK SIT | high SIT | |
|---|---|---|---|---|---|---|
| Best estimate | -1.16 | 1.26 | 23060 | 19910 | 3144 | 6 |
| Day 1 forecast | -1.14 | 1.24 | 23060 | 19465 | 3589 | 6 |
| Day 4 forecast | -1.14 | 1.24 | 23060 | 19397 | 3657 | 6 |
| Day 7 forecast | -1.12 | 1.23 | 23060 | 19176 | 3877 | 7 |
| Day 10 forecast | -1.13 | 1.23 | 23060 | 19180 | 3872 | 8 |
Numbers in the three rightmost columns are grid counts. Regions with high/low sea ice thickness correspond to areas with model offsets from the gridded observations outside of one standard deviation. (Standard deviations are provided in the observational product.)
Definition of categories:
| Category | Sea ice thickness |
|---|---|
| c1 | <1m |
| c2 | 1 - 1.5m |
| c3 | 1.5 - 2m |
| c4 | 2 - 2.5m |
| c5 | 2.5 - 3m |
| c6 | >3m |
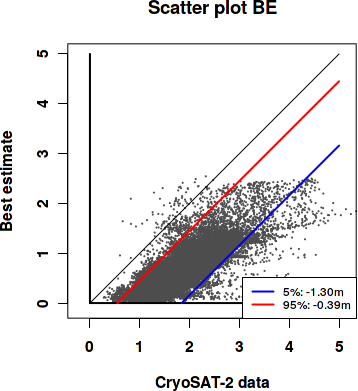
Best estimate vs. observations
Contingency table
| observations | |||||||||
|---|---|---|---|---|---|---|---|---|---|
| open | c1 | c2 | c3 | c4 | c5 | c6 | |||
| m o d e l |
open | 0 | 0.001 | 0.001 | 0 | 0 | 0 | 0 | |
| c1 | 0 | 0.078 | 0.252 | 0.22 | 0.195 | 0.028 | 0.007 | ||
| c2 | 0 | 0 | 0.001 | 0.021 | 0.068 | 0.054 | 0.02 | ||
| c3 | 0 | 0 | 0.001 | 0.004 | 0.008 | 0.009 | 0.014 | ||
| c4 | 0 | 0 | 0 | 0.001 | 0.001 | 0.003 | 0.012 | ||
| c5 | 0 | 0 | 0 | 0 | 0 | 0 | 0 | ||
| c6 | 0 | 0 | 0 | 0 | 0 | 0 | 0 | ||
See category definitions for details.
Statistical distribution
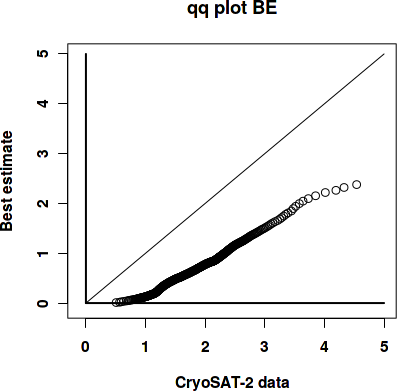
|
|
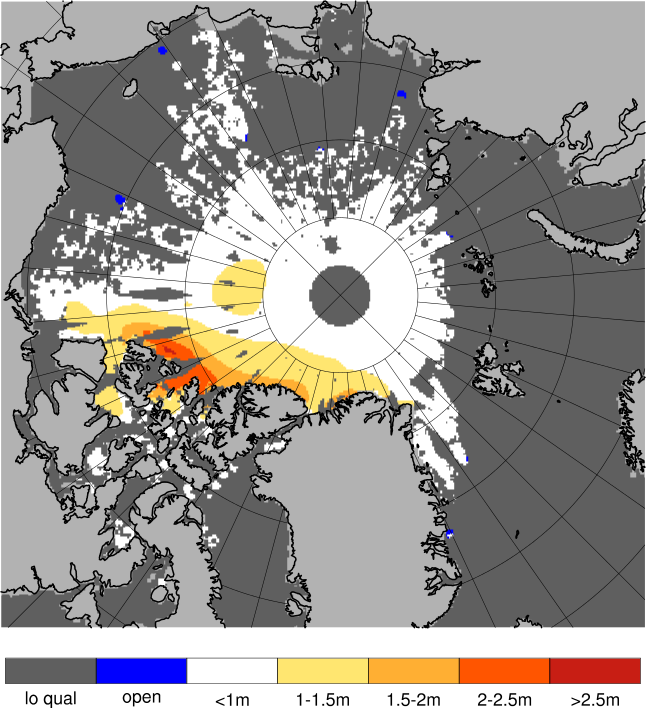
Observed sea ice thickness from CryoSAT
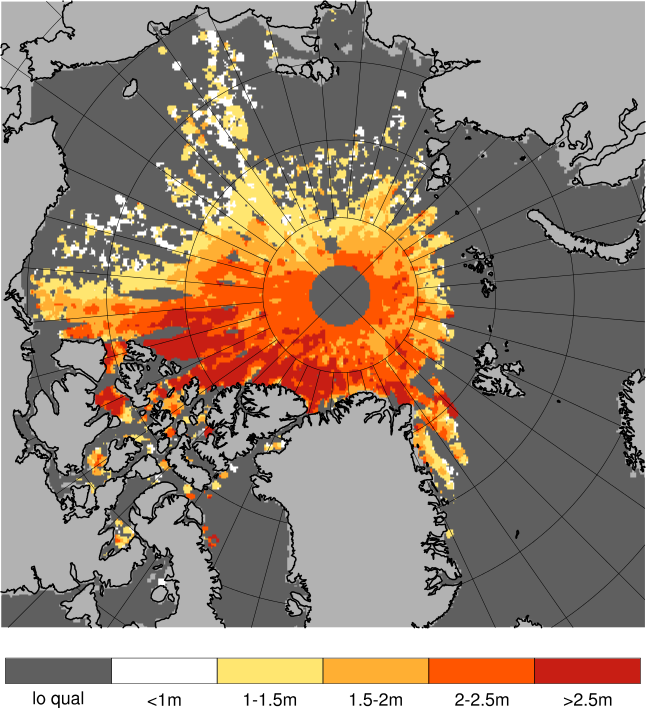
Sea ice thickness, best estimate product

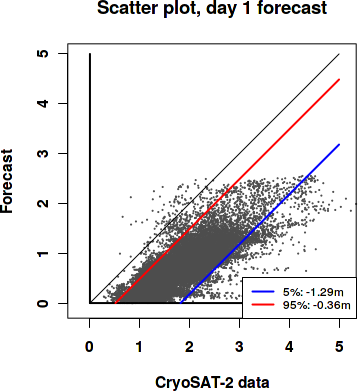
Day 1 forecast vs. observations
Contingency table
| observations | |||||||||
|---|---|---|---|---|---|---|---|---|---|
| open | c1 | c2 | c3 | c4 | c5 | c6 | |||
| m o d e l |
open | 0 | 0.002 | 0.002 | 0 | 0 | 0 | 0 | |
| c1 | 0 | 0.077 | 0.25 | 0.209 | 0.191 | 0.03 | 0.006 | ||
| c2 | 0 | 0 | 0.002 | 0.031 | 0.071 | 0.051 | 0.02 | ||
| c3 | 0 | 0 | 0.001 | 0.005 | 0.009 | 0.01 | 0.014 | ||
| c4 | 0 | 0 | 0 | 0.001 | 0.002 | 0.003 | 0.012 | ||
| c5 | 0 | 0 | 0 | 0 | 0 | 0 | 0.001 | ||
| c6 | 0 | 0 | 0 | 0 | 0 | 0 | 0 | ||
See category definitions for details.
Statistical distribution

|
|
Sea ice thickness, day 1 forecast
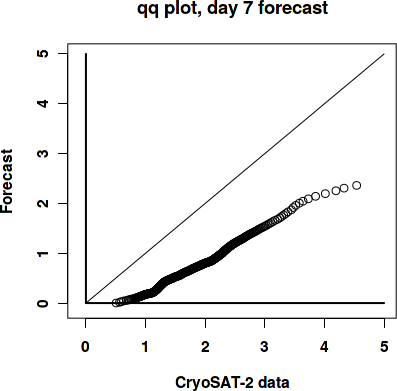
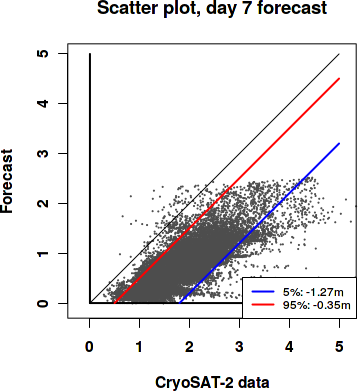
Day 7 forecast vs. observations
Contingency table
| observations | |||||||||
|---|---|---|---|---|---|---|---|---|---|
| open | c1 | c2 | c3 | c4 | c5 | c6 | |||
| m o d e l |
open | 0 | 0.002 | 0.002 | 0 | 0 | 0 | 0 | |
| c1 | 0 | 0.077 | 0.25 | 0.207 | 0.187 | 0.027 | 0.006 | ||
| c2 | 0 | 0 | 0.002 | 0.033 | 0.075 | 0.052 | 0.02 | ||
| c3 | 0 | 0 | 0.001 | 0.005 | 0.009 | 0.011 | 0.015 | ||
| c4 | 0 | 0 | 0 | 0.001 | 0.001 | 0.003 | 0.012 | ||
| c5 | 0 | 0 | 0 | 0 | 0 | 0 | 0 | ||
| c6 | 0 | 0 | 0 | 0 | 0 | 0 | 0 | ||
See category definitions for details.
Statistical distribution
|
|
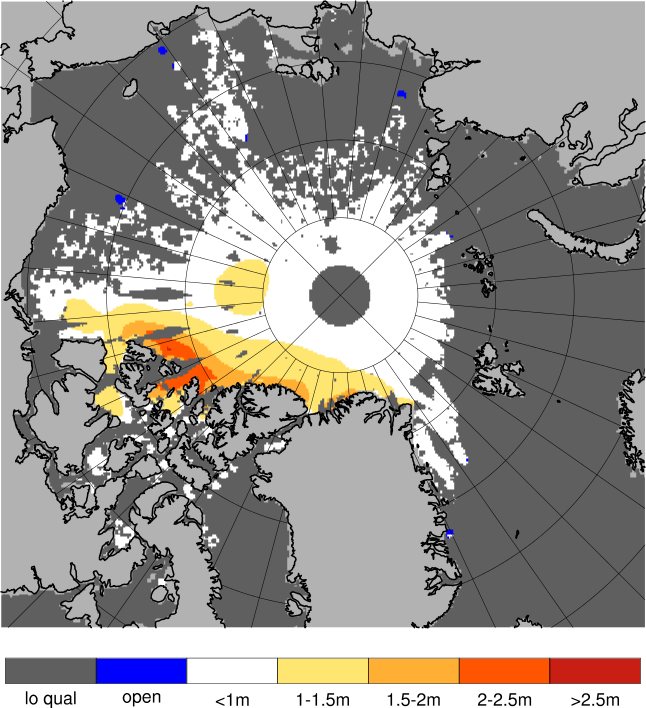
Sea ice thickness, day 7 forecast
Generated by /metno/routine/sms/V2/SIthickness/c2iceWebPage.sh Fri Nov 16 03:53:07 UTC 2018 on arcmfcval