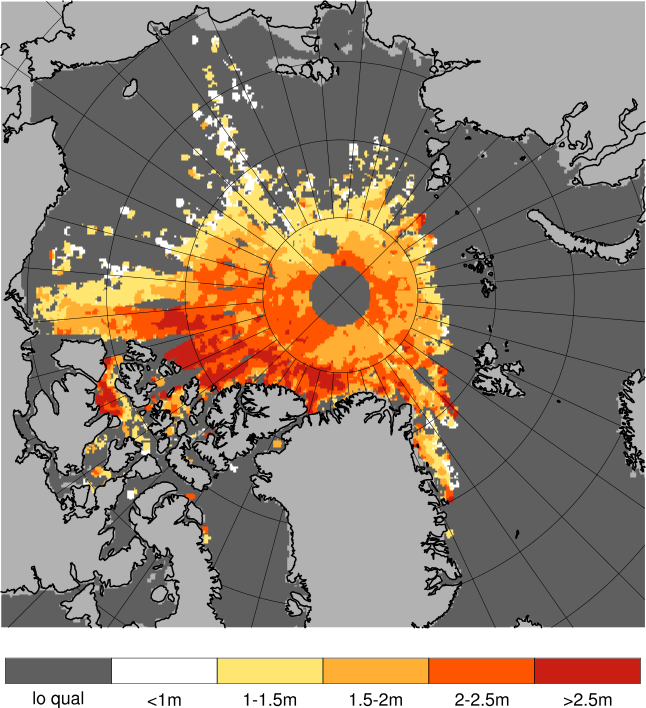
Validation of ice thickness - Full domain
Bulletin date: 2018-10-25
Model: ARC MFC - TOPAZ
Data source: UCL CryoSAT-2 sea ice thickness
Validation statistics summary
| Bias (m) | RMS (m) | total grids | low SIT | OK SIT | high SIT | |
|---|---|---|---|---|---|---|
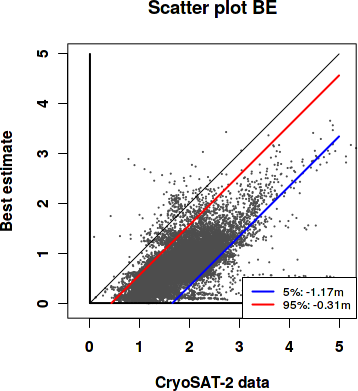
| Best estimate | -1.04 | 1.12 | 20606 | 15655 | 4937 | 14 |
| Day 1 forecast | -1.02 | 1.11 | 20606 | 15396 | 5196 | 14 |
| Day 4 forecast | -1.03 | 1.11 | 20606 | 15404 | 5188 | 14 |
| Day 7 forecast | -1.02 | 1.1 | 20606 | 15351 | 5241 | 14 |
| Day 10 forecast | -1.03 | 1.12 | 20606 | 15480 | 5112 | 14 |
Numbers in the three rightmost columns are grid counts. Regions with high/low sea ice thickness correspond to areas with model offsets from the gridded observations outside of one standard deviation. (Standard deviations are provided in the observational product.)
Definition of categories:
| Category | Sea ice thickness |
|---|---|
| c1 | <1m |
| c2 | 1 - 1.5m |
| c3 | 1.5 - 2m |
| c4 | 2 - 2.5m |
| c5 | 2.5 - 3m |
| c6 | >3m |
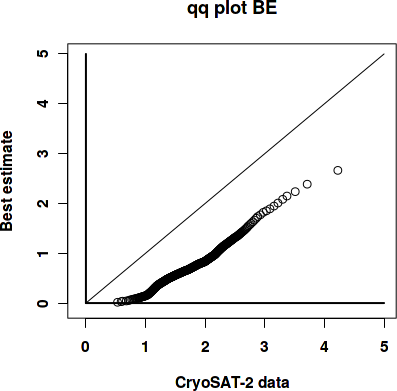
Best estimate vs. observations
Contingency table
| observations | |||||||||
|---|---|---|---|---|---|---|---|---|---|
| open | c1 | c2 | c3 | c4 | c5 | c6 | |||
| m o d e l |
open | 0 | 0.001 | 0.001 | 0 | 0 | 0 | 0 | |
| c1 | 0 | 0.068 | 0.253 | 0.258 | 0.168 | 0.018 | 0.002 | ||
| c2 | 0 | 0 | 0.006 | 0.048 | 0.081 | 0.041 | 0.005 | ||
| c3 | 0 | 0 | 0.001 | 0.005 | 0.012 | 0.008 | 0.008 | ||
| c4 | 0 | 0 | 0 | 0.002 | 0.002 | 0.001 | 0.005 | ||
| c5 | 0 | 0 | 0 | 0 | 0 | 0 | 0.002 | ||
| c6 | 0 | 0 | 0 | 0 | 0 | 0 | 0.001 | ||
See category definitions for details.
Statistical distribution
|
|
Observed sea ice thickness from CryoSAT
Sea ice thickness, best estimate product

Day 1 forecast vs. observations
Contingency table
| observations | |||||||||
|---|---|---|---|---|---|---|---|---|---|
| open | c1 | c2 | c3 | c4 | c5 | c6 | |||
| m o d e l |
open | 0 | 0.001 | 0.003 | 0 | 0 | 0 | 0 | |
| c1 | 0 | 0.067 | 0.25 | 0.255 | 0.166 | 0.018 | 0.002 | ||
| c2 | 0 | 0 | 0.007 | 0.051 | 0.082 | 0.04 | 0.005 | ||
| c3 | 0 | 0 | 0.001 | 0.006 | 0.013 | 0.008 | 0.008 | ||
| c4 | 0 | 0 | 0 | 0.003 | 0.002 | 0.001 | 0.006 | ||
| c5 | 0 | 0 | 0 | 0 | 0 | 0 | 0.002 | ||
| c6 | 0 | 0 | 0 | 0 | 0 | 0 | 0.001 | ||
See category definitions for details.
Statistical distribution

|

|
Sea ice thickness, day 1 forecast

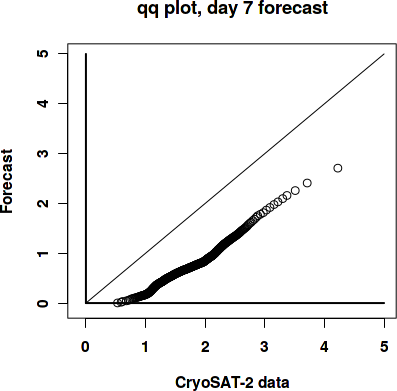
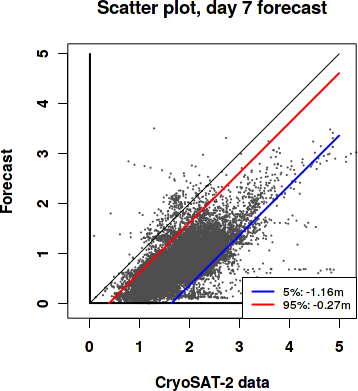
Day 7 forecast vs. observations
Contingency table
| observations | |||||||||
|---|---|---|---|---|---|---|---|---|---|
| open | c1 | c2 | c3 | c4 | c5 | c6 | |||
| m o d e l |
open | 0 | 0.001 | 0.003 | 0 | 0 | 0 | 0 | |
| c1 | 0 | 0.067 | 0.249 | 0.254 | 0.162 | 0.017 | 0.002 | ||
| c2 | 0 | 0 | 0.008 | 0.051 | 0.085 | 0.041 | 0.005 | ||
| c3 | 0 | 0 | 0.001 | 0.006 | 0.013 | 0.009 | 0.008 | ||
| c4 | 0 | 0 | 0 | 0.003 | 0.002 | 0.001 | 0.006 | ||
| c5 | 0 | 0 | 0 | 0 | 0 | 0 | 0.003 | ||
| c6 | 0 | 0 | 0 | 0 | 0 | 0 | 0.001 | ||
See category definitions for details.
Statistical distribution
|
|
Sea ice thickness, day 7 forecast
Generated by /metno/routine/sms/V2/SIthickness/c2iceWebPage.sh Fri Nov 9 03:53:36 UTC 2018 on arcmfcval