Validation of ice thickness - Full domain
Bulletin date: 2018-03-01
Model: ARC MFC - TOPAZ
Data source: UCL CryoSAT-2 sea ice thickness
Validation statistics summary
| Bias (m) | RMS (m) | total grids | low SIT | OK SIT | high SIT | |
|---|---|---|---|---|---|---|
| Best estimate | -0.93 | 1.1 | 44334 | 19472 | 24829 | 33 |
| Day 1 forecast | -0.93 | 1.09 | 44334 | 19204 | 25097 | 33 |
| Day 4 forecast | -0.93 | 1.09 | 44334 | 19359 | 24932 | 43 |
| Day 7 forecast | -0.91 | 1.08 | 44334 | 18764 | 25542 | 28 |
| Day 10 forecast | -0.92 | 1.08 | 44334 | 19187 | 25103 | 44 |
Numbers in the three rightmost columns are grid counts. Regions with high/low sea ice thickness correspond to areas with model offsets from the gridded observations outside of one standard deviation. (Standard deviations are provided in the observational product.)
Definition of categories:
| Category | Sea ice thickness |
|---|---|
| c1 | <1m |
| c2 | 1 - 1.5m |
| c3 | 1.5 - 2m |
| c4 | 2 - 2.5m |
| c5 | 2.5 - 3m |
| c6 | >3m |
Best estimate vs. observations
Contingency table
| observations | |||||||||
|---|---|---|---|---|---|---|---|---|---|
| open | c1 | c2 | c3 | c4 | c5 | c6 | |||
| m o d e l |
open | 0 | 0 | 0 | 0 | 0 | 0 | 0 | |
| c1 | 0 | 0.005 | 0.088 | 0.18 | 0.057 | 0.028 | 0.014 | ||
| c2 | 0 | 0 | 0.039 | 0.196 | 0.134 | 0.037 | 0.007 | ||
| c3 | 0 | 0 | 0.004 | 0.027 | 0.026 | 0.039 | 0.043 | ||
| c4 | 0 | 0 | 0 | 0.002 | 0.01 | 0.016 | 0.029 | ||
| c5 | 0 | 0 | 0 | 0 | 0.002 | 0.003 | 0.009 | ||
| c6 | 0 | 0 | 0 | 0 | 0 | 0.001 | 0.004 | ||
See category definitions for details.
Statistical distribution
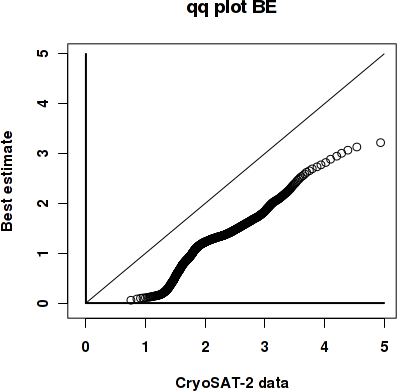
|
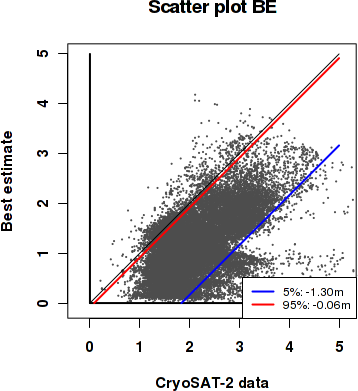
|
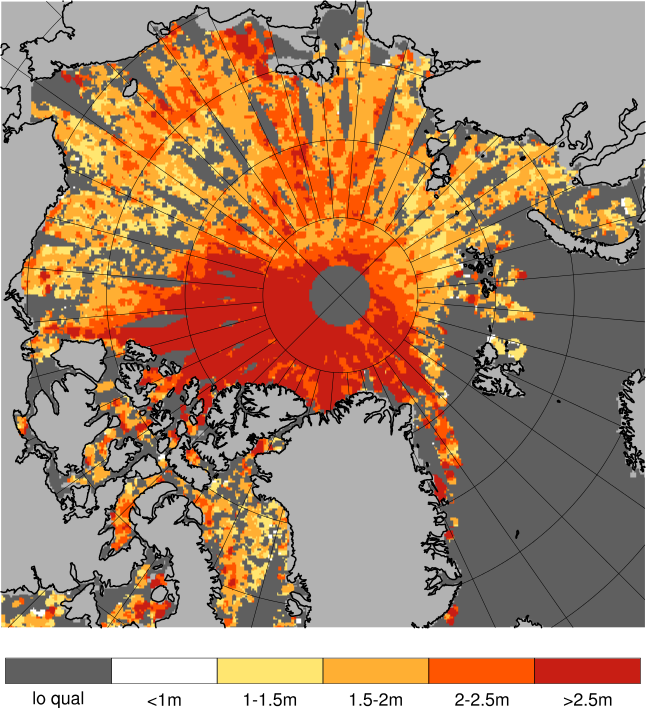
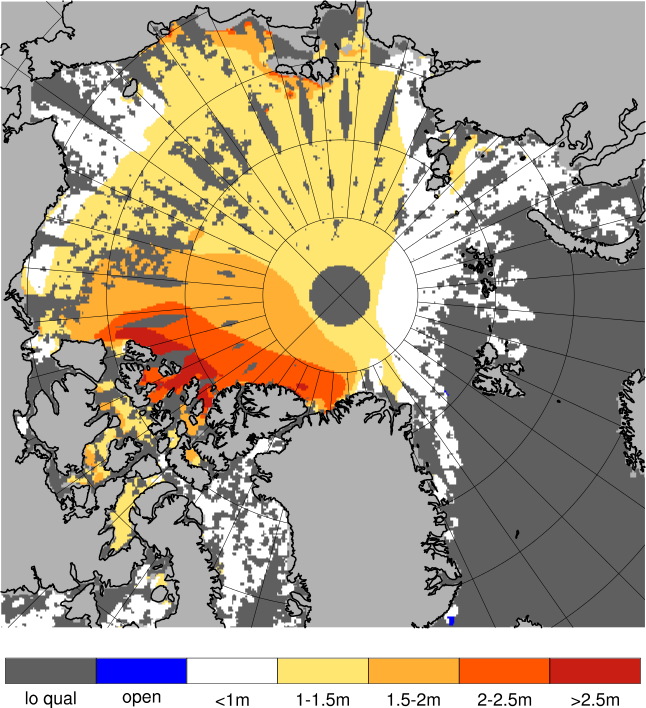
Observed sea ice thickness from CryoSAT
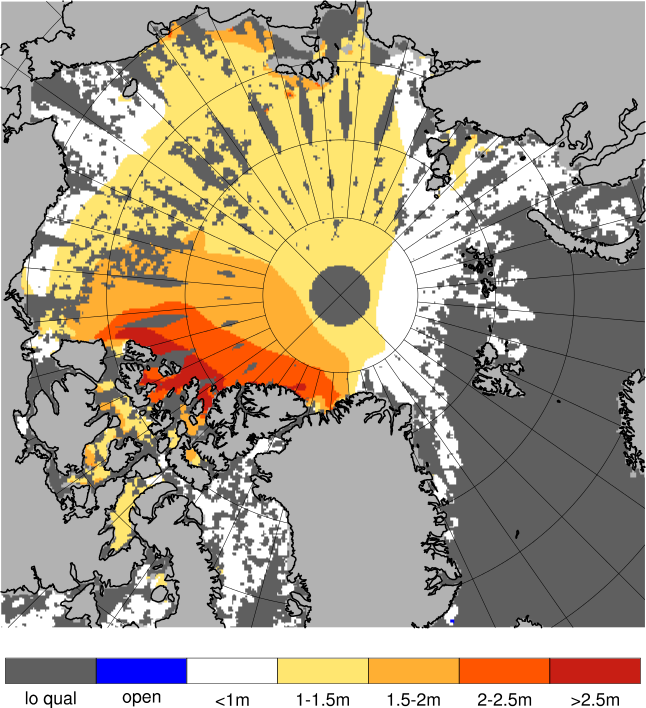
Sea ice thickness, best estimate product
Day 1 forecast vs. observations
Contingency table
| observations | |||||||||
|---|---|---|---|---|---|---|---|---|---|
| open | c1 | c2 | c3 | c4 | c5 | c6 | |||
| m o d e l |
open | 0 | 0 | 0 | 0 | 0 | 0 | 0 | |
| c1 | 0 | 0.005 | 0.088 | 0.179 | 0.055 | 0.024 | 0.013 | ||
| c2 | 0 | 0 | 0.039 | 0.197 | 0.135 | 0.041 | 0.008 | ||
| c3 | 0 | 0 | 0.004 | 0.026 | 0.026 | 0.037 | 0.043 | ||
| c4 | 0 | 0 | 0 | 0.002 | 0.01 | 0.018 | 0.029 | ||
| c5 | 0 | 0 | 0 | 0 | 0.001 | 0.003 | 0.009 | ||
| c6 | 0 | 0 | 0 | 0 | 0 | 0.001 | 0.003 | ||
See category definitions for details.
Statistical distribution
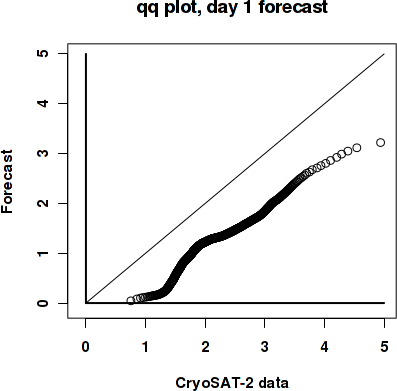
|
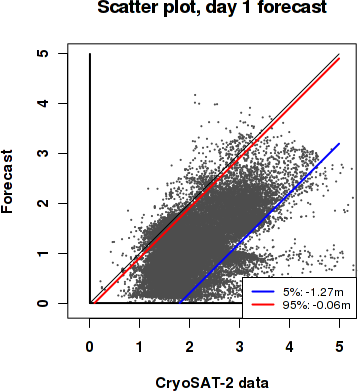
|
Sea ice thickness, day 1 forecast

Day 7 forecast vs. observations
Contingency table
| observations | |||||||||
|---|---|---|---|---|---|---|---|---|---|
| open | c1 | c2 | c3 | c4 | c5 | c6 | |||
| m o d e l |
open | 0 | 0 | 0 | 0 | 0 | 0 | 0 | |
| c1 | 0 | 0.005 | 0.087 | 0.176 | 0.054 | 0.023 | 0.013 | ||
| c2 | 0 | 0.001 | 0.04 | 0.198 | 0.135 | 0.039 | 0.007 | ||
| c3 | 0 | 0 | 0.004 | 0.028 | 0.026 | 0.04 | 0.043 | ||
| c4 | 0 | 0 | 0 | 0.002 | 0.012 | 0.019 | 0.03 | ||
| c5 | 0 | 0 | 0 | 0 | 0.002 | 0.003 | 0.01 | ||
| c6 | 0 | 0 | 0 | 0 | 0 | 0.001 | 0.002 | ||
See category definitions for details.
Statistical distribution
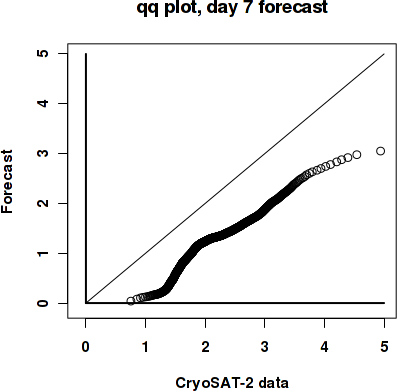
|
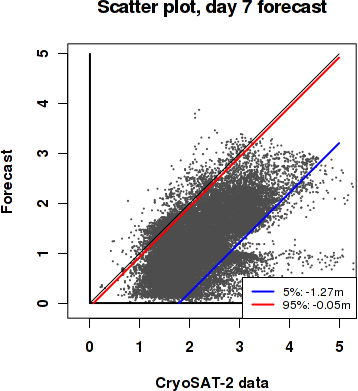
|
Sea ice thickness, day 7 forecast
Generated by /metno/routine/sms/V2/SIthickness/c2iceWebPage.sh Fri Mar 16 03:53:38 UTC 2018 on arcmfcval