Validation of ice thickness - Full domain
Bulletin date: 2018-01-18
Model: ARC MFC - TOPAZ
Data source: UCL CryoSAT-2 sea ice thickness
Validation statistics summary
| Bias (m) | RMS (m) | total grids | low SIT | OK SIT | high SIT | |
|---|---|---|---|---|---|---|
| Best estimate | -0.93 | 1.07 | 40224 | 20083 | 20118 | 23 |
| Day 1 forecast | -0.92 | 1.07 | 40224 | 19838 | 20358 | 28 |
| Day 4 forecast | -0.93 | 1.08 | 40224 | 20178 | 20020 | 26 |
| Day 7 forecast | -0.91 | 1.06 | 40224 | 19456 | 20742 | 26 |
| Day 10 forecast | -0.93 | 1.08 | 40224 | 20099 | 20093 | 32 |
Numbers in the three rightmost columns are grid counts. Regions with high/low sea ice thickness correspond to areas with model offsets from the gridded observations outside of one standard deviation. (Standard deviations are provided in the observational product.)
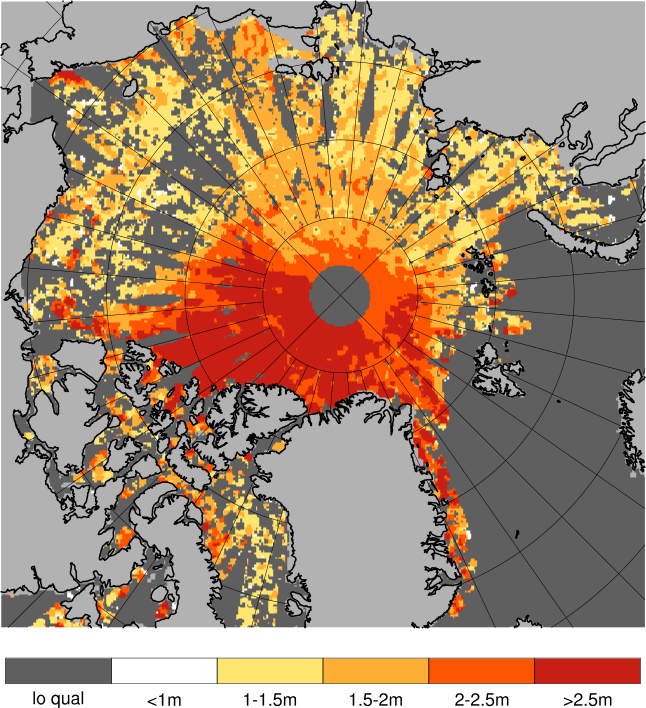
Definition of categories:
| Category | Sea ice thickness |
|---|---|
| c1 | <1m |
| c2 | 1 - 1.5m |
| c3 | 1.5 - 2m |
| c4 | 2 - 2.5m |
| c5 | 2.5 - 3m |
| c6 | >3m |
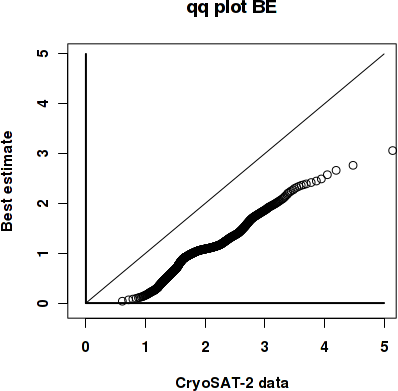
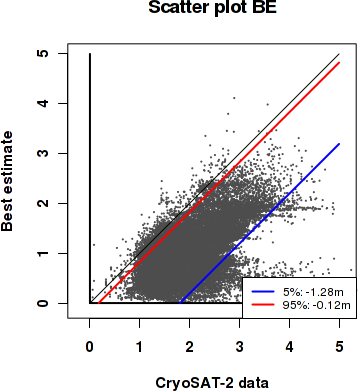
Best estimate vs. observations
Contingency table
| observations | |||||||||
|---|---|---|---|---|---|---|---|---|---|
| open | c1 | c2 | c3 | c4 | c5 | c6 | |||
| m o d e l |
open | 0 | 0 | 0 | 0 | 0 | 0 | 0 | |
| c1 | 0 | 0.014 | 0.233 | 0.18 | 0.069 | 0.028 | 0.01 | ||
| c2 | 0 | 0.001 | 0.058 | 0.129 | 0.069 | 0.049 | 0.004 | ||
| c3 | 0 | 0 | 0.003 | 0.014 | 0.024 | 0.048 | 0.03 | ||
| c4 | 0 | 0 | 0 | 0.001 | 0.007 | 0.01 | 0.012 | ||
| c5 | 0 | 0 | 0 | 0 | 0 | 0.001 | 0.003 | ||
| c6 | 0 | 0 | 0 | 0 | 0 | 0 | 0 | ||
See category definitions for details.
Statistical distribution
|
|
Observed sea ice thickness from CryoSAT
Sea ice thickness, best estimate product

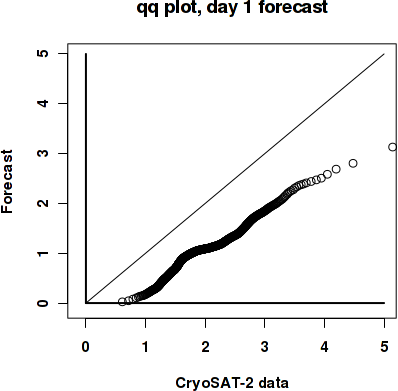
Day 1 forecast vs. observations
Contingency table
| observations | |||||||||
|---|---|---|---|---|---|---|---|---|---|
| open | c1 | c2 | c3 | c4 | c5 | c6 | |||
| m o d e l |
open | 0 | 0 | 0 | 0 | 0 | 0 | 0 | |
| c1 | 0 | 0.014 | 0.229 | 0.176 | 0.068 | 0.028 | 0.01 | ||
| c2 | 0 | 0.002 | 0.062 | 0.134 | 0.072 | 0.05 | 0.004 | ||
| c3 | 0 | 0 | 0.002 | 0.013 | 0.024 | 0.048 | 0.031 | ||
| c4 | 0 | 0 | 0 | 0.001 | 0.007 | 0.009 | 0.011 | ||
| c5 | 0 | 0 | 0 | 0 | 0 | 0.002 | 0.003 | ||
| c6 | 0 | 0 | 0 | 0 | 0 | 0 | 0.001 | ||
See category definitions for details.
Statistical distribution
|

|
Sea ice thickness, day 1 forecast

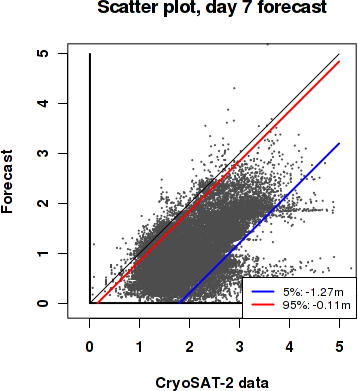
Day 7 forecast vs. observations
Contingency table
| observations | |||||||||
|---|---|---|---|---|---|---|---|---|---|
| open | c1 | c2 | c3 | c4 | c5 | c6 | |||
| m o d e l |
open | 0 | 0 | 0 | 0 | 0 | 0 | 0 | |
| c1 | 0 | 0.014 | 0.225 | 0.171 | 0.068 | 0.028 | 0.009 | ||
| c2 | 0 | 0.002 | 0.065 | 0.138 | 0.071 | 0.05 | 0.004 | ||
| c3 | 0 | 0 | 0.003 | 0.015 | 0.024 | 0.047 | 0.03 | ||
| c4 | 0 | 0 | 0 | 0.001 | 0.007 | 0.01 | 0.012 | ||
| c5 | 0 | 0 | 0 | 0 | 0 | 0.001 | 0.003 | ||
| c6 | 0 | 0 | 0 | 0 | 0 | 0 | 0.001 | ||
See category definitions for details.
Statistical distribution

|
|
Sea ice thickness, day 7 forecast
Generated by /metno/routine/sms/V2/SIthickness/c2iceWebPage.sh Fri Feb 2 03:53:20 UTC 2018 on arcmfcval