Validation of ice thickness - Full domain
Bulletin date: 2017-02-16
Model: ARC MFC - TOPAZ
Data source: UCL CryoSAT-2 sea ice thickness
Validation statistics summary
| Bias (m) | RMS (m) | total grids | low SIT | OK SIT | high SIT | |
|---|---|---|---|---|---|---|
| Best estimate | -0.85 | 1.04 | 45268 | 18482 | 26698 | 88 |
| Day 1 forecast | -0.85 | 1.04 | 45268 | 18645 | 26544 | 79 |
| Day 4 forecast | -0.86 | 1.05 | 45268 | 18870 | 26328 | 70 |
| Day 7 forecast | -0.84 | 1.04 | 45268 | 18373 | 26788 | 107 |
| Day 10 forecast | -0.86 | 1.06 | 45268 | 19124 | 26080 | 64 |
Numbers in the three rightmost columns are grid counts. Regions with high/low sea ice thickness correspond to areas with model offsets from the gridded observations outside of one standard deviation. (Standard deviations are provided in the observational product.)
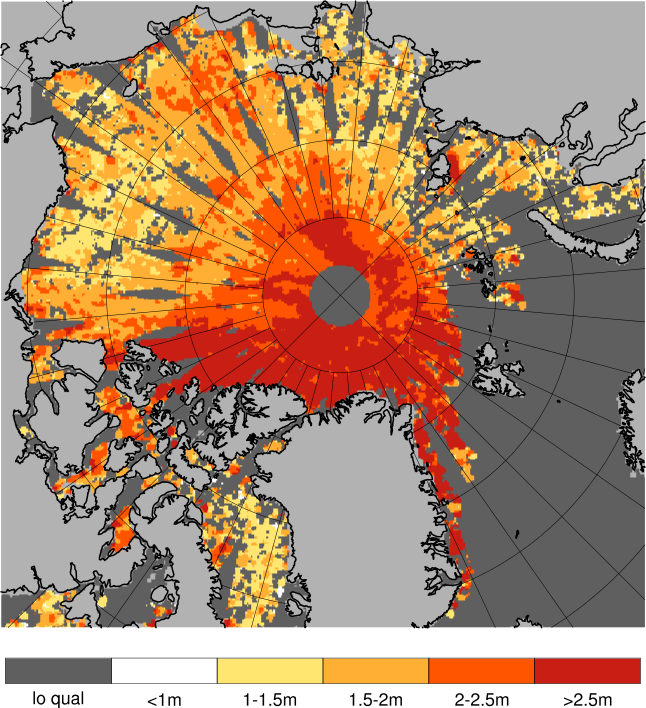
Definition of categories:
| Category | Sea ice thickness |
|---|---|
| c1 | <1m |
| c2 | 1 - 1.5m |
| c3 | 1.5 - 2m |
| c4 | 2 - 2.5m |
| c5 | 2.5 - 3m |
| c6 | >3m |
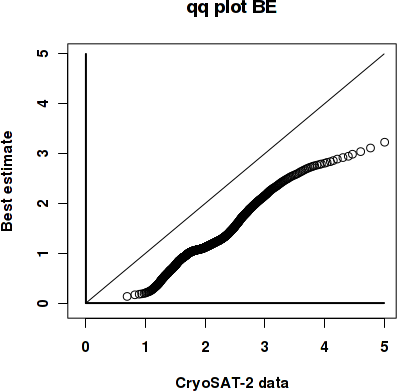
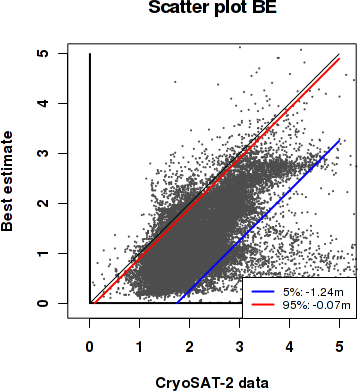
Best estimate vs. observations
Contingency table
| observations | |||||||||
|---|---|---|---|---|---|---|---|---|---|
| open | c1 | c2 | c3 | c4 | c5 | c6 | |||
| m o d e l |
open | 0 | 0 | 0 | 0 | 0 | 0 | 0 | |
| c1 | 0 | 0.006 | 0.123 | 0.146 | 0.053 | 0.026 | 0.014 | ||
| c2 | 0 | 0.001 | 0.06 | 0.189 | 0.116 | 0.035 | 0.008 | ||
| c3 | 0 | 0 | 0.003 | 0.031 | 0.037 | 0.038 | 0.01 | ||
| c4 | 0 | 0 | 0.001 | 0.004 | 0.015 | 0.032 | 0.015 | ||
| c5 | 0 | 0 | 0 | 0.001 | 0.001 | 0.006 | 0.026 | ||
| c6 | 0 | 0 | 0 | 0 | 0 | 0.001 | 0.006 | ||
See category definitions for details.
Statistical distribution
|
|
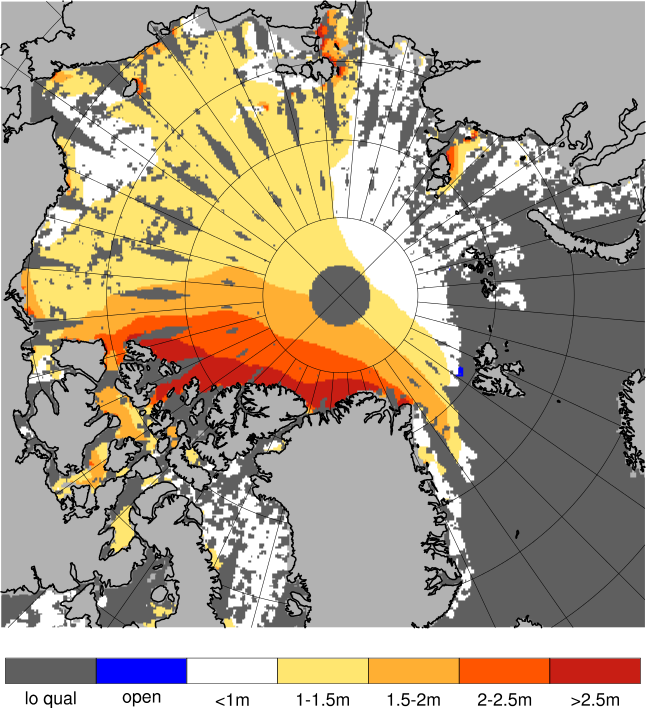
Observed sea ice thickness from CryoSAT
Sea ice thickness, best estimate product

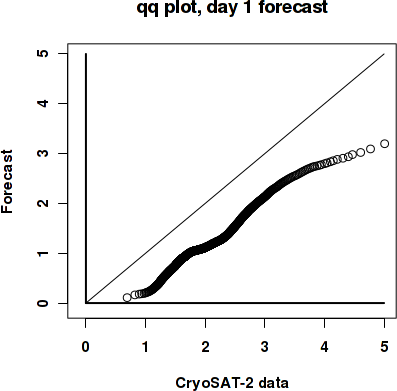
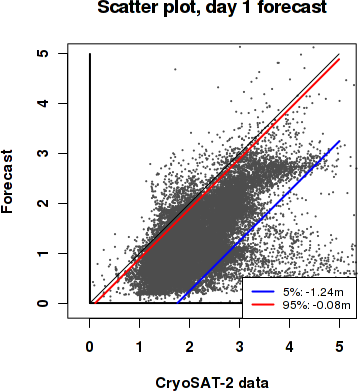
Day 1 forecast vs. observations
Contingency table
| observations | |||||||||
|---|---|---|---|---|---|---|---|---|---|
| open | c1 | c2 | c3 | c4 | c5 | c6 | |||
| m o d e l |
open | 0 | 0 | 0 | 0 | 0 | 0 | 0 | |
| c1 | 0 | 0.006 | 0.125 | 0.147 | 0.055 | 0.027 | 0.014 | ||
| c2 | 0 | 0.001 | 0.058 | 0.186 | 0.114 | 0.034 | 0.007 | ||
| c3 | 0 | 0 | 0.003 | 0.031 | 0.039 | 0.039 | 0.01 | ||
| c4 | 0 | 0 | 0.001 | 0.004 | 0.014 | 0.031 | 0.016 | ||
| c5 | 0 | 0 | 0 | 0.001 | 0.001 | 0.005 | 0.025 | ||
| c6 | 0 | 0 | 0 | 0 | 0 | 0.001 | 0.006 | ||
See category definitions for details.
Statistical distribution
|
|
Sea ice thickness, day 1 forecast

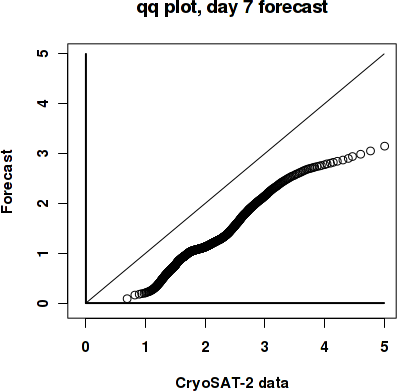
Day 7 forecast vs. observations
Contingency table
| observations | |||||||||
|---|---|---|---|---|---|---|---|---|---|
| open | c1 | c2 | c3 | c4 | c5 | c6 | |||
| m o d e l |
open | 0 | 0 | 0 | 0 | 0 | 0 | 0 | |
| c1 | 0 | 0.006 | 0.12 | 0.142 | 0.053 | 0.025 | 0.014 | ||
| c2 | 0 | 0.001 | 0.062 | 0.189 | 0.114 | 0.036 | 0.008 | ||
| c3 | 0 | 0 | 0.003 | 0.033 | 0.038 | 0.038 | 0.01 | ||
| c4 | 0 | 0 | 0.001 | 0.004 | 0.015 | 0.031 | 0.016 | ||
| c5 | 0 | 0 | 0 | 0.001 | 0.001 | 0.005 | 0.026 | ||
| c6 | 0 | 0 | 0 | 0 | 0 | 0.001 | 0.005 | ||
See category definitions for details.
Statistical distribution
|

|
Sea ice thickness, day 7 forecast
Generated by /metno/routine/sms/V2/SIthickness/c2iceWebPage.sh on. 25. okt. 12:22:46 +0000 2017 on arcmfcval