Copernicus Marine Service Arctic MFC: Validation of sea ice concentration

Validation results: Regional ice charts

Results by bulletin date
January 2024
01-04
01-11
01-18
01-25

February 2024
02-01
02-08
02-15
02-22
02-29

March 2024
03-07
03-14
03-21
03-28

January 2023
01-05
01-12
01-19
01-26

February 2023
02-02
02-09
02-16
02-23

March 2023
03-02
03-09
03-16
03-23
03-30

April 2023
04-06
04-13
04-20
04-27

May 2023
05-04
05-11
05-18
05-25

June 2023
06-01
06-08
06-15
06-22
06-29

July 2023
07-06
07-13
07-20
07-27

August 2023
08-03
08-10
08-17
08-24
08-31

September 2023
09-07
09-14
09-21
09-28

October 2023
10-05
10-12
10-19
10-26

November 2023
11-02
11-09
11-16
11-23
11-30

December 2023
12-07
12-14
12-21
12-28

January 2022
01-06
01-13
01-20
01-27

February 2022
02-03
02-10
02-17
02-24

March 2022
03-03
03-10
03-17
03-24
03-31

April 2022
04-07
04-14
04-21
04-28

May 2022
05-05
05-12
05-19
05-26

June 2022
06-02
06-09
06-16
06-23
06-30

July 2022
07-07
07-14
07-21
07-28

August 2022
08-04
08-11
08-18
08-25

September 2022
09-01
09-08
09-15
09-22
09-29

October 2022
10-06
10-13
10-20
10-27

November 2022
11-03
11-10
11-17
11-24

December 2022
12-01
12-08
12-15
12-22
12-29

January 2021
01-07
01-14
01-21
01-28

February 2021
02-04
02-11
02-18
02-25

March 2021
03-04
03-11
03-18
03-25

April 2021
04-01
04-08
04-15
04-22
04-29

May 2021
05-06
05-13
05-20
05-27

June 2021
06-03
06-10
06-17
06-24

July 2021
07-01
07-08
07-15
07-22
07-29

August 2021
08-05
08-12
08-19
08-26

September 2021
09-02
09-09
09-16
09-23
09-30

October 2021
10-07
10-14
10-21
10-28

November 2021
11-04
11-11
11-18
11-25

December 2021
12-02
12-09
12-16
12-23
12-30

January 2020
01-02
01-09
01-16
01-23
01-30

February 2020
02-06
02-13
02-20
02-27

March 2020
03-05
03-12
03-19
03-26

April 2020
04-02
04-09
04-16
04-23
04-30

May 2020
05-07
05-14
05-21
05-28

June 2020
06-04
06-11
06-18
06-25

July 2020
07-02
07-09
07-16
07-23
07-30

August 2020
08-06
08-13
08-20
08-27

September 2020
09-03
09-10
09-17
09-24

October 2020
10-01
10-08
10-15
10-22
10-29

November 2020
11-05
11-12
11-19
11-26

December 2020
12-03
12-10
12-17
12-24
12-31

January 2019
01-03
01-10
01-17
01-24
01-31

February 2019
02-07
02-14
02-21
02-28

March 2019
03-07
03-14
03-21
03-28

April 2019
04-04
04-11
04-18
04-25

May 2019
05-02
05-09
05-16
05-23
05-30

June 2019
06-06
06-13
06-20
06-27

July 2019
07-04
07-11
07-18
07-25

August 2019
08-01
08-08
08-15
08-22
08-29

September 2019
09-05
09-12
09-19
09-26

October 2019
10-03
10-10
10-17
10-24
10-31

November 2019
11-07
11-14
11-21
11-28

December 2019
12-05
12-12
12-19
12-26

January 2018
01-04
01-11
01-18
01-25

February 2018
02-01
02-08
02-15
02-22

March 2018
03-01
03-08
03-15
03-22
03-29

April 2018
04-05
04-12
04-19
04-26

May 2018
05-03
05-10
05-17
05-24
05-31

June 2018
06-07
06-14
06-21
06-28

July 2018
07-05
07-12
07-19
07-26

August 2018
08-02
08-09
08-16
08-23
08-30

September 2018
09-06
09-13
09-20
09-27

October 2018
10-04
10-11
10-18
10-25

November 2018
11-01
11-08
11-15
11-22
11-29

December 2018
12-06
12-13
12-20
12-27

January 2017
01-05
01-12
01-19
01-26

February 2017
02-02
02-09
02-16
02-23

March 2017
03-02
03-09
03-16
03-23
03-30

April 2017
04-06
04-13
04-20
04-27

May 2017
05-04
05-11
05-18
05-25

June 2017
06-01
06-08
06-15
06-22
06-29

July 2017
07-06
07-13
07-20
07-27

August 2017
08-03
08-10
08-17
08-24
08-31

September 2017
09-07
09-14
09-21
09-28

October 2017
10-05
10-12
10-19
10-26

November 2017
11-02
11-09
11-16
11-23
11-30

December 2017
12-07
12-14
12-21
12-28

January 2016
01-07
01-14
01-21
01-28

February 2016
02-04
02-11
02-18
02-25

March 2016
03-03
03-10
03-17
03-24
03-31

April 2016
04-07
04-14
04-21
04-28

May 2016
05-05
05-12
05-19
05-26

June 2016
06-02
06-09
06-16
06-23
06-30

July 2016
07-07
07-14
07-21
07-28

August 2016
08-04
08-11
08-18
08-25

September 2016
09-01
09-08
09-15
09-22
09-29

October 2016
10-06
10-13
10-20
10-27

November 2016
11-03
11-10
11-17
11-24

December 2016
12-01
12-08
12-15
12-22
12-29

January 2015
01-01
01-08
01-15
01-22
01-29

February 2015
02-05
02-12
02-19
02-26

March 2015
03-05
03-12
03-19
03-26

April 2015
04-02
04-09
04-16
04-23
04-30

May 2015
05-07
05-14
05-21
05-28

June 2015
06-04
06-11
06-18
06-25

July 2015
07-02
07-09
07-16
07-23
07-30

August 2015
08-06
08-13
08-20
08-27

September 2015
09-03
09-10
09-17
09-24

October 2015
10-01
10-08
10-15
10-22
10-29

November 2015
11-05
11-12
11-19
11-26

December 2015
12-03
12-10
12-17
12-24
12-31

January 2014
01-02
01-09
01-16
01-23
01-30

February 2014
02-06
02-13
02-20
02-27

March 2014
03-06
03-13
03-20
03-27

April 2014
04-03
04-10
04-17
04-24

May 2014
05-01
05-08
05-15
05-22
05-29

June 2014
06-05
06-12
06-19
06-26

July 2014
07-03
07-10
07-17
07-24
07-31

August 2014
08-07
08-14
08-21
08-28

September 2014
09-04
09-11
09-18
09-25

October 2014
10-02
10-09
10-16
10-23
10-30

November 2014
11-06
11-13
11-20
11-27

December 2014
12-04
12-11
12-18
12-25

January 2013
01-03
01-10
01-17
01-24
01-31

February 2013
02-07
02-14
02-21
02-28

March 2013
03-07
03-14
03-21
03-28

April 2013
04-04
04-11
04-18
04-25

May 2013
05-02
05-09
05-16
05-23
05-30

June 2013
06-06
06-13
06-20
06-27

July 2013
07-04
07-11
07-18
07-25

August 2013
08-01
08-08
08-15
08-22
08-29

September 2013
09-05
09-12
09-19
09-26

October 2013
10-03
10-10
10-17
10-24
10-31

November 2013
11-07
11-14
11-21
11-28

December 2013
12-05
12-12
12-19
12-26

January 2012
01-04
01-11
01-18
01-25

February 2012
02-01
02-08
02-15
02-22
02-29

March 2012
03-07
03-14
03-21
03-28

April 2012
04-04
04-11
04-18
04-25

May 2012
05-02
05-09
05-16
05-23
05-30

June 2012
06-06
06-07
06-14
06-21
06-28

July 2012
07-05
07-12
07-19
07-26

August 2012
08-02
08-09
08-16
08-23
08-30

September 2012
09-06
09-13
09-20
09-27

October 2012
10-04
10-11
10-18
10-25

November 2012
11-01
11-08
11-15
11-22
11-29

December 2012
12-06
12-13
12-20
12-27

December 2011
12-28

Production update

Sea ice concentration

    An extensive analysis of ice edge displacement metrics validation results from 2017 was performed during the 2018/2019 winter, and the results were subsequently published. The study concluded with a recommendation of a suitable set of metrics that was selected from a perspective on information of simplicity and necessity. This recommendations were implemented in the presentation of validation vs. regional ice charts above starting with the 2019-05-16 bulletin. For the validation vs. OSI SAF data, the recommendations were miplemted starting with the 2019-06-06 bulletin.
  • The article where the analysis is presented was published in Ocean Science, full reference:
    Melsom, A., Palerme, C., and Müller, M.:
    Validation metrics for ice edge position forecasts,
    Ocean Sci., 15, 615-630, doi:10.5194/os-15-615-2019, 2019.
    Starting with the presentation of validation results for the 2013-01-02 bulletin, significant changes to the validation of sea ice concentration and sea ice edge position have been implemented:
  • In order to reduce the contribution of results that are far away from the marginal ice zone (MIZ), two new ice classes have been included in the observational product: (1) Ice free near the MIZ, (2) Very Close Drift Ice near the MIZ (see the contingency tables); here "near" means within a distance of 200 km from the MIZ
  • RMS of sea ice concentration no longer includes results more than 200 km away from the observed MIZ
  • The RMS values are thus not consistent with those computed before this update, and the time series of validation results for sea ice concentration now start with the bulletin from 2012-12-06 (results were re-processed with the modified algorithm for the 2012-12 bulletins)

New products

  1. Results for the sea ice edge position is now extended by including the position bias. A positive bias means that the modeled sea ice edge is on the open ocean side of the observed edge. Note that this metric can be interpreted as a proxy for sea ice extent.
  2. We now also provide the bias of the sea ice edge. In the validation algorithm, the sea ice edge is composed of a line of grid cells. The new metric thus gives this bias in units of grid cells (presently, each grid cell represent a square of size 12.5 km x 12.5 km). A positive bias means that the sea ice edge is longer in the model results that in the observational data.

Documentation

These web pages contain an outline of the validation algorithm. Download this document for a detailed description of the algorithm, the observations that are used etc. Furthermore, as stated above, the selection of displacement metrics follows the recommendations provided in this article.

Validation data: Regional ice charts

Validation of the Copernicus Marine Arctic MFC results for sea ice concentrations is performed using the ice chart data from the Copernicus Marine Sea ice & Wind TAC. The region for which the ice charts are available, is shown in the sample snap-shot below. Ice charts are available daily, but not for Saturdays, Sundays and public holidays in Norway. The horizontal resolution of the ice chart data is 1 km.

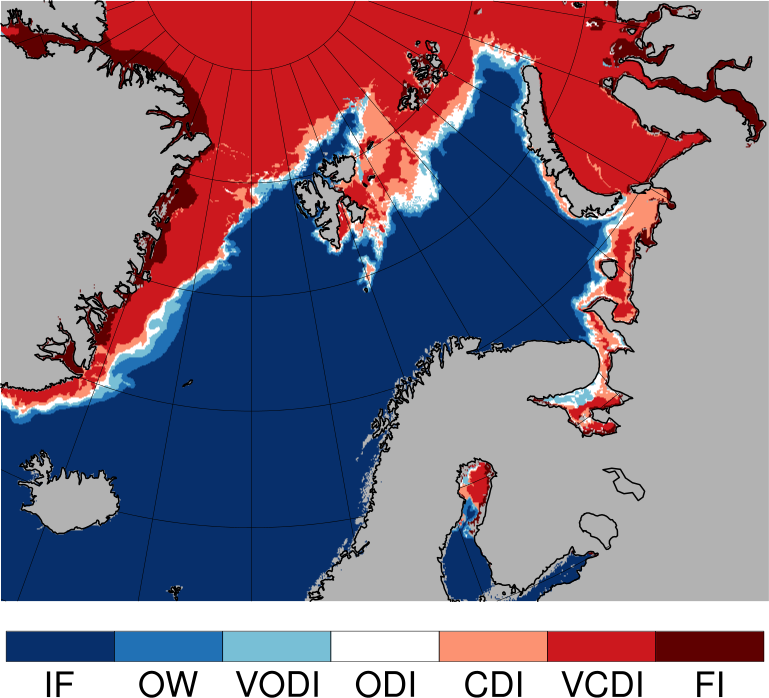
These sea ice classes correspond to the following sea ice concentrations (discrete values with an interval of 0.1):

  • Open Water (OW): 0.0
  • Very Open Drift Ice (VODI): 0.1, 0.2, 0.3
  • Open Drift Ice (ODI): 0.4, 0.5, 0.6
  • Close Drift Ice (CDI): 0.7, 0.8
  • Very Close Drift Ice (VCDI): 0.9, 1.0
  • Fast Ice (FI): 1.0

In addition, regions with no ice is defined as a separate class Ice Free (IF). Note that our model does not distunguish between classes VCDI and "Fast Ice", so these two classes are also merged into one class in the validation, which will be referred to as Very Close Drift Ice. Note also that for the observational products, classes IF and VCDI have been split according to the distance from the MIZ.

Ice chart data are available from Copernicus Marine product SEAICE_ARC_SEAICE_L4_NRT_OBSERVATIONS_011_002.


Validation results: N. hemisphere SSMIS sea ice concentration

Results by bulletin date
January 2024
01-04
01-11
01-18
01-25

February 2024
02-01
02-08
02-15
02-22
02-29

March 2024
03-07
03-14
03-21
03-28

January 2023
01-05
01-12
01-19
01-26

February 2023
02-02
02-09
02-16
02-23

March 2023
03-02
03-09
03-16
03-23
03-30

April 2023
04-06
04-13
04-20
04-27

May 2023
05-04
05-11
05-18
05-25

June 2023
06-01
06-08
06-15
06-22
06-29

July 2023
07-06
07-13
07-20
07-27

August 2023
08-03
08-10
08-17
08-24
08-31

September 2023
09-07
09-14
09-21
09-28

October 2023
10-05
10-12
10-19
10-26

November 2023
11-02
11-09
11-16
11-23
11-30

December 2023
12-07
12-14
12-21
12-28

January 2022
01-06
01-13
01-20
01-27

February 2022
02-03
02-10
02-17
02-24

March 2022
03-03
03-10
03-17
03-24
03-31

April 2022
04-07
04-14
04-21
04-28

May 2022
05-05
05-12
05-19
05-26

June 2022
06-02
06-09
06-16
06-23
06-30

July 2022
07-07
07-14
07-21
07-28

August 2022
08-04
08-11
08-18
08-25

September 2022
09-01
09-08
09-15
09-22
09-29

October 2022
10-06
10-13
10-20
10-27

November 2022
11-03
11-10
11-17
11-24

December 2022
12-01
12-08
12-15
12-22
12-29

January 2021
01-07
01-14
01-21
01-28

February 2021
02-04
02-11
02-18
02-25

March 2021
03-04
03-11
03-18
03-25

April 2021
04-01
04-08
04-15
04-22
04-29

May 2021
05-06
05-13
05-20
05-27

June 2021
06-03
06-10
06-17
06-24

July 2021
07-01
07-08
07-15
07-22
07-29

August 2021
08-05
08-12
08-19
08-26

September 2021
09-02
09-09
09-16
09-23
09-30

October 2021
10-07
10-14
10-21
10-28

November 2021
11-04
11-11
11-18
11-25

December 2021
12-02
12-09
12-16
12-23
12-30

January 2020
01-02
01-09
01-16
01-23
01-30

February 2020
02-06
02-13
02-20
02-27

March 2020
03-05
03-12
03-19
03-26

April 2020
04-02
04-09
04-16
04-23
04-30

May 2020
05-07
05-14
05-21
05-28

June 2020
06-04
06-11
06-18
06-25

July 2020
07-02
07-09
07-16
07-23
07-30

August 2020
08-06
08-13
08-20
08-27

September 2020
09-03
09-10
09-17
09-24

October 2020
10-01
10-08
10-15
10-22
10-29

November 2020
11-05
11-12
11-19
11-26

December 2020
12-03
12-10
12-17
12-24
12-31

January 2019
01-03
01-10
01-17
01-24
01-31

February 2019
02-07
02-14
02-21
02-28

March 2019
03-07
03-14
03-21
03-28

April 2019
04-04
04-11
04-18
04-25

May 2019
05-02
05-09
05-16
05-23
05-30

June 2019
06-06
06-13
06-20
06-27

July 2019
07-04
07-11
07-18
07-25

August 2019
08-01
08-08
08-15
08-22
08-29

September 2019
09-05
09-12
09-19
09-26

October 2019
10-03
10-10
10-17
10-24
10-31

November 2019
11-07
11-14
11-21
11-28

December 2019
12-05
12-12
12-19
12-26

January 2018
01-04
01-11
01-18
01-25

February 2018
02-01
02-08
02-15
02-22

March 2018
03-01
03-08
03-15
03-22
03-29

April 2018
04-05
04-12
04-19
04-26

May 2018
05-03
05-10
05-17
05-24
05-31

June 2018
06-07
06-14
06-21
06-28

July 2018
07-05
07-12
07-19
07-26

August 2018
08-02
08-09
08-16
08-23
08-30

September 2018
09-06
09-13
09-20
09-27

October 2018
10-04
10-11
10-18
10-25

November 2018
11-01
11-08
11-15
11-22
11-29

December 2018
12-06
12-13
12-20
12-27

January 2017
01-05
01-12
01-19
01-26

February 2017
02-02
02-09
02-16
02-23

March 2017
03-02
03-09
03-16
03-23
03-30

April 2017
04-06
04-13
04-20
04-27

May 2017
05-04
05-11
05-18
05-25

June 2017
06-01
06-08
06-15
06-22
06-29

July 2017
07-06
07-13
07-20
07-27

August 2017
08-03
08-10
08-17
08-24
08-31

September 2017
09-07
09-14
09-21
09-28

October 2017
10-05
10-12
10-19
10-26

November 2017
11-02
11-09
11-16
11-23
11-30

December 2017
12-07
12-14
12-21
12-28

January 2016
01-07
01-14
01-21
01-28

February 2016
02-04
02-11
02-18
02-25

March 2016
03-03
03-10
03-17
03-24
03-31

April 2016
04-07
04-14
04-21
04-28

May 2016
05-05
05-12
05-19
05-26

June 2016
06-02
06-09
06-16
06-23
06-30

July 2016
07-07
07-14
07-21
07-28

August 2016
08-04
08-11
08-18
08-25

September 2016
09-01
09-08
09-15
09-22
09-29

October 2016
10-06
10-13
10-20
10-27

November 2016
11-03
11-10
11-17
11-24

December 2016
12-01
12-08
12-15
12-22
12-29

January 2015
01-01
01-08
01-15
01-22
01-29

February 2015
02-05
02-12
02-19
02-26

March 2015
03-05
03-12
03-19
03-26

April 2015
04-02
04-09
04-16
04-23
04-30

May 2015
05-07
05-14
05-21
05-28

June 2015
06-04
06-11
06-18
06-25

July 2015
07-02
07-09
07-16
07-23
07-30

August 2015
08-06
08-13
08-20
08-27

September 2015
09-03
09-10
09-17
09-24

October 2015
10-01
10-08
10-15
10-22
10-29

November 2015
11-05
11-12
11-19
11-26

December 2015
12-03
12-10
12-17
12-24
12-31

January 2014
01-02
01-09
01-16
01-23
01-30

February 2014
02-06
02-13
02-20
02-27

March 2014
03-06
03-13
03-20
03-27

April 2014
04-03
04-10
04-17
04-24

May 2014
05-01
05-08
05-15
05-22
05-29

June 2014
06-05
06-12
06-19
06-26

July 2014
07-03
07-10
07-17
07-24
07-31

August 2014
08-07
08-14
08-21
08-28

September 2014
09-04
09-11
09-18
09-25

October 2014
10-02
10-09
10-16
10-23
10-30

November 2014
11-06
11-13
11-20
11-27

December 2014
12-04
12-11
12-18
12-25

Validation data: N. hemisphere SSMIS sea ice concentration

Validation of the Copernicus Marine Arctic MFC results for sea ice concentrations described above is supplemented by a validation using the OSI SAF multi-sensor SSMIS passive microwave data provided to Copernicus Marine by OSI SAF as the observational reference. This product has a much coarser horizontal resolution than the ice charts, and the model results are not independent of these data. However, in contrast to ice charts, the OSI SAF products covers the entire region with ice infested waters in the northern hemisphere, so results from this validation provide information about the model performance in regions not covered by ice charts.

Validation results are provided for Arctic sectors, and (for 2017 onward) for the 13 GODAE regions.

OSI SAF sea ice concentrations based on SSMIS data are available from Copernicus Marine product SEAICE_GLO_SEAICE_L4_NRT_OBSERVATIONS_011_001, dataset METNO-GLO-SEAICE_CONC-NORTH-L4-NRT-OBS.


Validation results: N. hemisphere AMSR2 sea ice concentration

Results by bulletin date
January 2024
01-04
01-11
01-18
01-25

February 2024
02-01
02-08
02-15
02-22
02-29

March 2024
03-07
03-14
03-21
03-28

January 2023
01-05
01-12
01-19
01-26

February 2023
02-02
02-09
02-16
02-23

March 2023
03-02
03-09
03-16
03-23
03-30

April 2023
04-06
04-13
04-20
04-27

May 2023
05-04
05-11
05-18
05-25

June 2023
06-01
06-08
06-15
06-22
06-29

July 2023
07-06
07-13
07-20
07-27

August 2023
08-03
08-10
08-17
08-24
08-31

September 2023
09-07
09-14
09-21
09-28

October 2023
10-05
10-12
10-19
10-26

November 2023
11-02
11-09
11-16
11-23
11-30

December 2023
12-07
12-14
12-21
12-28

January 2022
01-06
01-13
01-20
01-27

February 2022
02-03
02-10
02-17
02-24

March 2022
03-03
03-10
03-17
03-24
03-31

April 2022
04-07
04-14
04-21
04-28

May 2022
05-05
05-12
05-19
05-26

June 2022
06-02
06-09
06-16
06-23
06-30

July 2022
07-07
07-14
07-21
07-28

August 2022
08-04
08-11
08-18
08-25

September 2022
09-01
09-08
09-15
09-22
09-29

October 2022
10-06
10-13
10-20
10-27

November 2022
11-03
11-10
11-17
11-24

December 2022
12-01
12-08
12-15
12-22
12-29

Validation data: N. hemisphere AMSR2 sea ice concentration

Validation of the Copernicus Marine Arctic MFC results for sea ice concentrations described above is here further supplemented by a validation using the AMSR2 data provided to Copernicus Marine Service as the observational reference. This product is available on the same domain and projection, the same spatial resolution and with the same update frequency as the multi-sensor SSMIS product above.

Validation results are provided for Arctic sectors.

AMSR2 sea ice concentrations are available from Copernicus Marine product SEAICE_GLO_SEAICE_L4_NRT_OBSERVATIONS_011_001, dataset osisaf_obs-si_glo_phy-sic-north_nrt_amsr2_l4_P1D-m..


ARC-MFC PHYS (TOPAZ)

The model results are produced with the TOPAZ ocean data assimilation model system (Copernicus Marine product ARCTIC_ANALYSIS_FORECAST_PHYS_002_001_a). Presently, TOPAZ is run weekly with data assimillation one week prior to the bulletin date, followed by a one-week 100 member ensemble simulation ending on the bulletin date, and finally a 10 day deterministic forecast. TOPAZ was developed and is maintained by the Nansen Center.

ARC-MFC PHYS (TOPAZ) results are available as Copernicus Marine product ARCTIC_ANALYSIS_FORECAST_PHYS_002_001_a. An archive of historical forecasts are available from a thredds server.

 
See Met Privacy